

Chart 1 - All Non-EU - Applicant volumes at Jan, Jun and End of Cycle

Chart 2 - All Non-EU - % of End of Cycle Applicants applied at Jan & Jun deadlines

Chart 3 - China - % of End of Cycle Applicants applied at Jan & Jun deadlines

Chart 4 - China - % of End of Cycle Applicants applied at Jan & Jun deadlines.

Chart 5 - India - % of End of Cycle Applicants applied at Jan & Jun deadlines

Chart 6 - India - % of End of Cycle Applicants applied at Jan & Jun deadlines
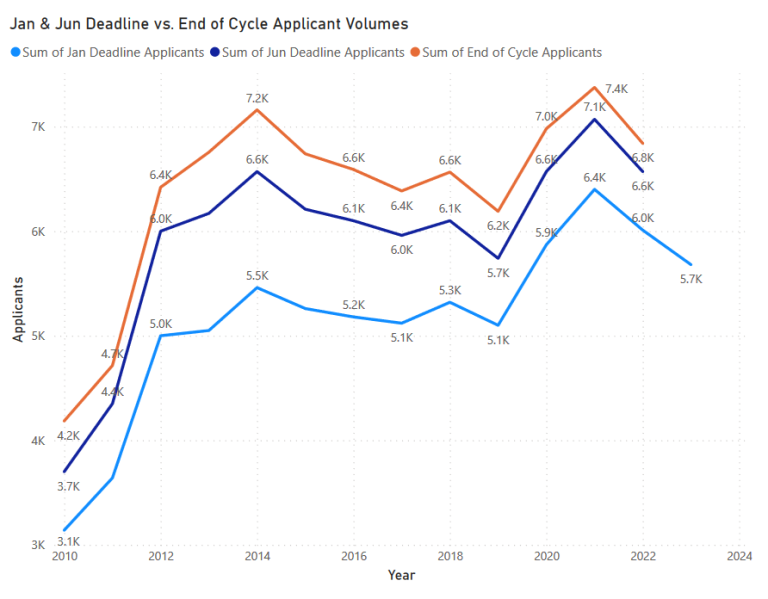
Chart 7 - Hong Kong - Applicant volumes at Jan, Jun and End of Cycle
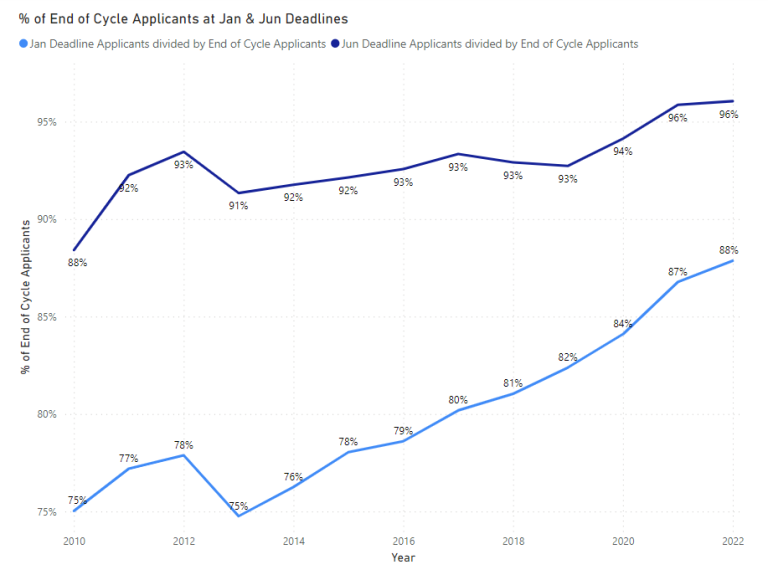
Chart 8 - Hong Kong - % of End of Cycle Applicants applied at Jan & Jun deadlines
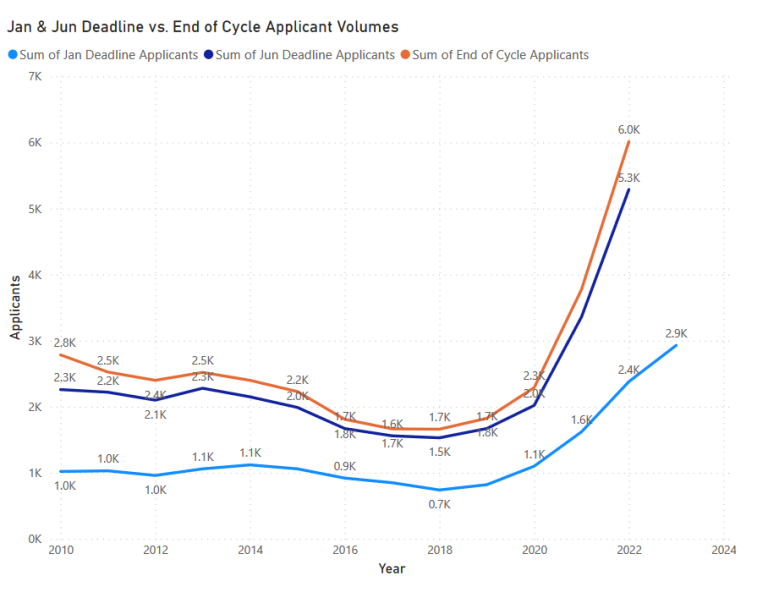
Chart 9 - Nigeria - % of End of Cycle Applicants applied at Jan & Jun deadlines
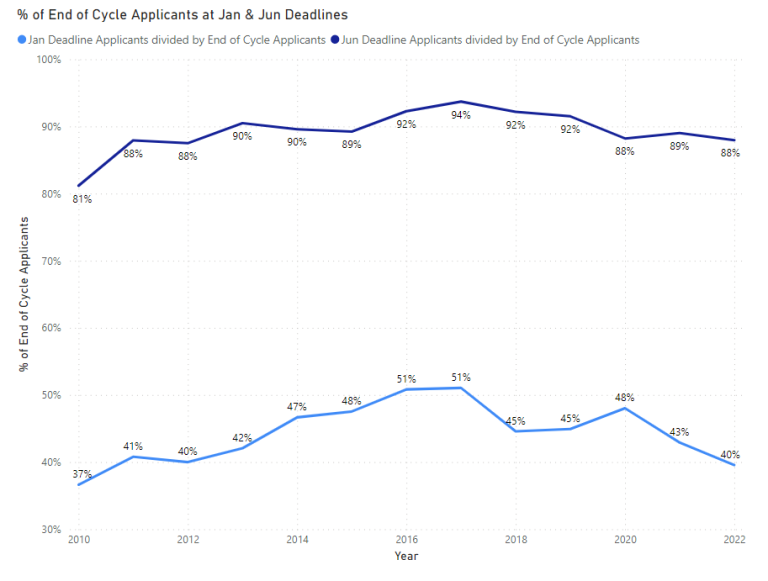
Chart 10 - Nigeria - % of End of Cycle Applicants applied at Jan & Jun deadlines
Undergraduate application trends - UCAS
We’ve seen extreme growth in PGT degrees for many UK institutions in the past few years but; as questions increase over how responsible/sustainable this growth is; as other key host destinations bounce back and compete harder for market share; and as our own government undermines stability in the largest area of international student recruitment, I thought it would be interesting to take a look at the UG market ahead of the June deadline for UCAS applications, observe and comment on recent data and trends of some of the most significant Non-EU markets.
UG recruitment – Strong growth opportunity, buffered from market and political instability
UG students offer institutions the security of multiple years of tuition revenue, fewer concerns of heavily skewed subject and nationality diversity as well as, on account of the higher time and cost commitment, fewer concerns over the affordability and ultimate objectives of those coming to pursue undergraduate degrees.
UG data - A useful and timely guide for broader recruitment
Unlike PGT, Non-EU UG recruitment has grown steadily rather than drastically in recent years. Despite differences, many trends we observe at UG are aligned to those we see at PGT e.g. very strong South Asia and Sub-Saharan Africa growth and a partial rebound from the more Covid-cautious countries of East and South East Asia etc.
The similarities ,as much as the differences, between UG and PGT recruitment make the UCAS data interesting. UCAS 2022 End of Cycle is far more recent than HESA, and when combined with forward looking data on 2023 applicants and recent visa data, can offer a great deal of insight into current trends.
There is opportunity to analyse, benchmark and forecast individual institution performance with sufficient time, for incisive recruiters, to adjust strategy and tactics in order to, particularly for late markets, positively impact 2023 recruitment. Elsewhere it allows an early chance to review performance and start to lay plans for the next cycle.
Overall Non-EU - Applicant Growth
All Non-EU applicants saw 4.2% YOY applicant growth to the Jan ’23 deadline. The % of End of Cycle applicants applied by January and June deadlines (Chart 2) shows that the proportion applying by the January steadily increasing over time until a sharp drop in 2022. The proportion of applicants applying by the June deadline was quite constant until it dropped significantly in 2022. The 2022 drop is down to:
a, the increasing proportion of applicants from South Asia and Sub-Saharan Africa (typically later markets), but also
b, because these markets themselves had a higher proportion of late applicants in 2022 than in previous years.
Data on route taken by students from these countries indicates a big jump in the percentage coming via RPAs, which could be partially as a result of how pathway students are admitted to their partner universities and explain some of this change.
China - Modest declines, but opportunity for 2023 upturn
China saw a 4.2% YOY decline in applicants to Jan ’23. The % of End of Cycle applicants applied by January and June deadlines (Chart 4), show Chinese UCAS applicants getting earlier over time. Due to their volume this trend for earlier applications has been a key driver in the steady rise of all Non-EU applicants applying by the January deadline (as mentioned above and in Chart 2).
The high % of End of Cycle applicants applied by January (86% in 2022) would normally mean January applicant figures are a strong indicator of final applicant volumes, but the timing and sudden nature of China dropping Covid restrictions leaves potential for more late applicants than usual this cycle.
Where will China numbers end up in 2023? The decline of 14% in study visas issued to Chinese students in 2022 suggests a downward trend as did very weak YOY visa numbers for Q1 2023. In my opinion, the abrupt and unexpected end of Covid restrictions in China were too late for positive impact to show in Q1 visas.
A recent survey by INTO University Partnerships indicated 74% of Chinese agents expected to send more students to the UK this year than last which, whilst down slightly on the same survey in 2022, suggests optimism which when combined with an improved landscape for travel abroad will have me looking at the June UCAS figures and Q2 visa data with keen interest in the coming weeks.
India - Continue UG growth on the cards
India has seen a 5.4% growth in applicants at the Jan ’23 deadline, continuing its long period of growth at UG. The % of End of Cycle applicants applied by January and June deadlines (Chart 6) shows some volatility in recent years, with 2022 in particular showing very steep falls in the % of final applicant totals who had applied by January and June.
Looking at the acceptance route of India students through UCAS in 2022 vs. 2021 the % who came via RPA in 2021 was 16% and in 2022 this jumped to 36%, more than double the rate of all Non-EU acceptances. As mentioned above, strong pathway recruitment and progression could be a factor in this rise.
Looking at recent visa data on India, the huge growth in 2022 suggests that when HESA 22/23 data is released, it’ll show strong Indian growth again.
Q1 2023 visa data was actually marginally down on Q1 2022… which could suggest that the plateauing of Indian student recruitment, which had to come some time, may finally be arriving at PGT (where there are significant Q1 study intakes). At UG there looks to still be room for growth, though the route these students will take to UG study is harder to pin down.
Hong Kong - Continuing decline or post Covid restriction lift?
Hong Kong saw a 5.5% decline in applications at the January deadline. Looking at past trends, the proportion of students applied by the January deadline has steadily increased over time. This was the second year in a row where January deadlines have been down after the peak in 2021.
When looking at the historic relationship between January, June and End of Cycle figures, we can see almost all applicants have applied by June. In 2023, as is the case for China, much depends on whether the dropping of Covid restrictions provides a boost to late applications in 2023 as families and students feel safer applying to travel overseas for study in the knowledge they can move freely to and from HK and the UK if they want or need to. For Hong Kong, the visa trend in 2022 vs. 2021 was weaker, and this was also the case for Q1.
Figures released on June deadline applications next week will be very interesting, as will information from IB results released to students today. We’ve seen a slight decline in the % of HK applicants being accepted in the past 2 years, and also a reduced % going through clearing. Potential for this moving back towards higher levels (of acceptances and those placed in clearing) seem quite high.
Nigeria – Very strong growth set to continue, big potential student pool if acceptance rates stabilise or rise
Nigerian applicant numbers have continued to soar in 2023… with a 23% increase in applicants to the January deadline making Nigeria the fastest growing of the top 10 Non-EU countries for applicants from 2022 (though U.A.E is not far behind on 21%).
Looking at the trend over time, and the sheer number of late applicants coming from Nigeria, it suggests an even higher growth in applicants by June and to the End of Cycle. This is because the % of Nigerians applying by January and June has been steadily decreasing over time.
There's still potential for even higher growth than these numbers might suggest. Will we see a surge in applicants on account of planned restrictions on dependents?
Also, there’s been a sharp decline in the % of Nigerian applicants being accepted for places in recent years. Will this trend continue, or will some universities seek to maximise enrolment opportunities from the very large pool of available applicants?